Edit chart
Loading graph
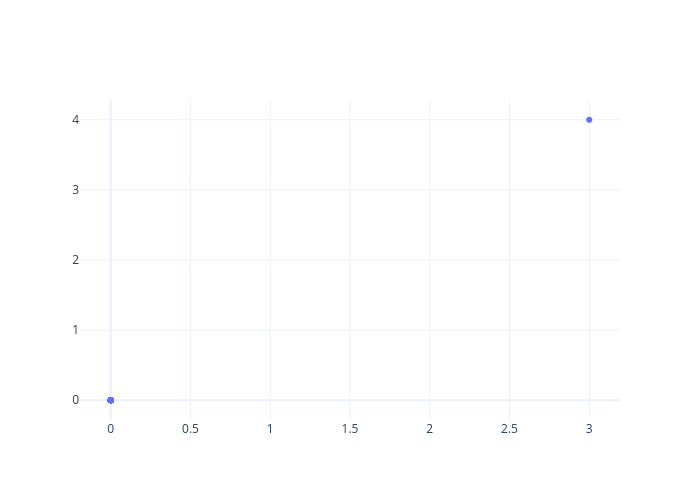
Rasoulalipourpegpt's interactive graph and data is a scatter chart. The x-axis shows values from -0.18198179393382352 to 3.1819850939338234. The y-axis shows values from -0.2865946876767092 to 4.286596977676709.