Edit chart
Loading graph
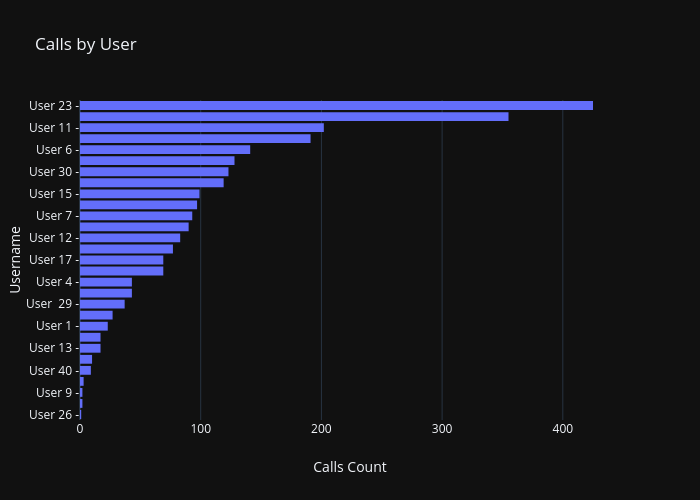
Rafa_san's interactive graph and data of "Calls by User" is a bar chart; with Calls Count in the x-axis and Username in the y-axis.. The x-axis shows values from 0 to 447.36842105263156. The y-axis shows values from -0.5 to 28.5.