Edit chart
Loading graph
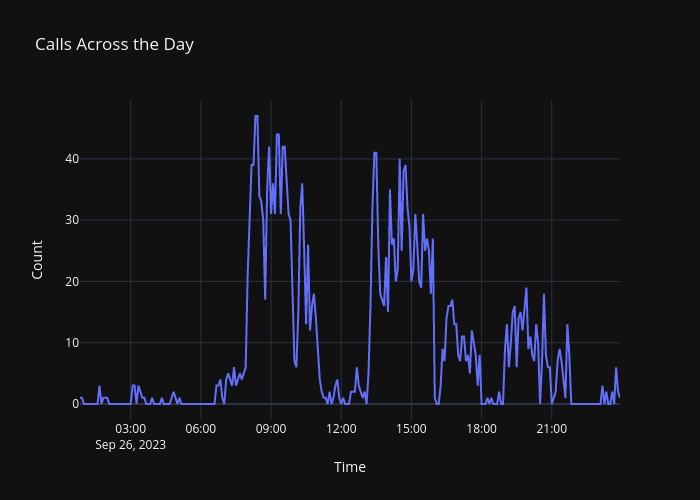
Rafa_san's interactive graph and data of "Calls Across the Day" is a line chart; with Time in the x-axis and Count in the y-axis.. The x-axis shows values from 2023-09-26 00:50 to 2023-09-26 23:55. The y-axis shows values from -2.611111111111111 to 49.611111111111114.