Edit chart
Loading graph
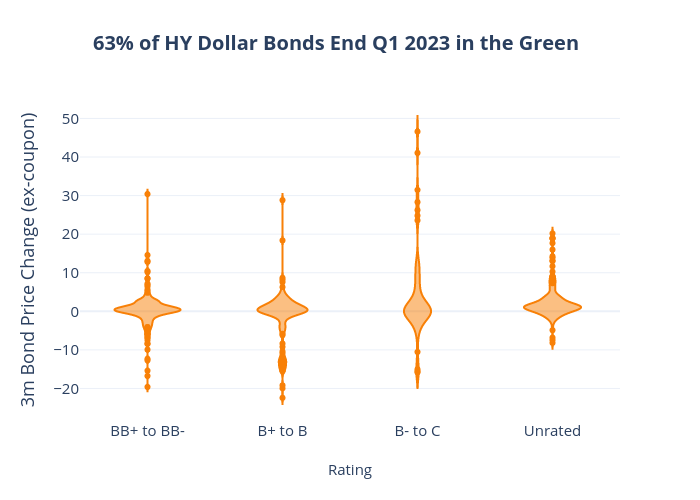
Raahil5hah's interactive graph and data of "63% of HY Dollar Bonds End Q1 2023 in the Green" is a violin; with Rating in the x-axis and 3m Bond Price Change (ex-coupon) in the y-axis.. The x-axis shows values from 0.5 to 4.5. The y-axis shows values from -28.180047003522702 to 54.78702475883537.