Edit chart
Loading graph
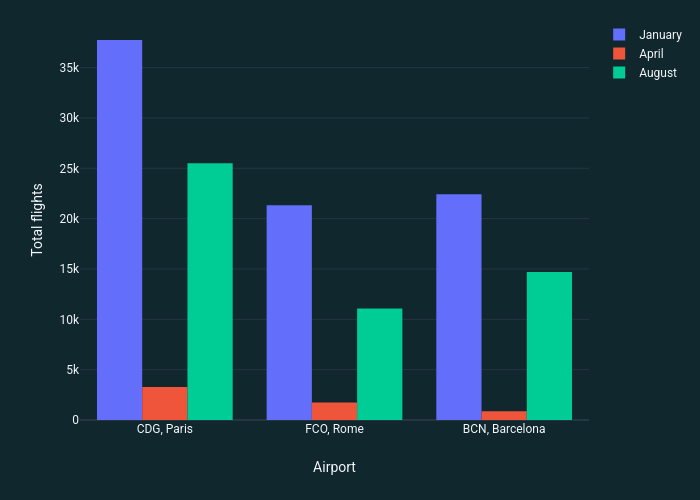
Quentin-spire's interactive graph and data of "" is a grouped bar chart, showing January, April, August; with Airport in the x-axis and Total flights in the y-axis.. The x-axis shows values from -0.5 to 2.5. The y-axis shows values from 0 to 39729.47368421053.