Edit chart
Loading graph
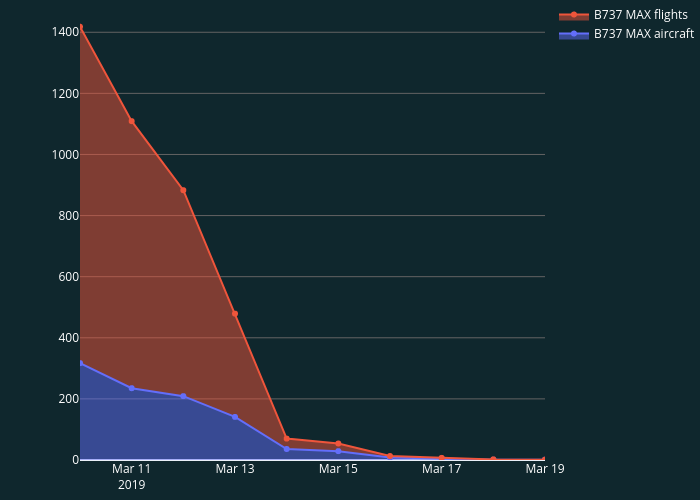
Quentin-spire's interactive graph and data of "B737 MAX aircraft vs B737 MAX flights" is a , showing B737 MAX aircraft vs B737 MAX flights; with time in the x-axis. The x-axis shows values from 2019-03-10 to 2019-03-19. The y-axis shows values from 0 to 1500.6472862666476.