Edit chart
Loading graph
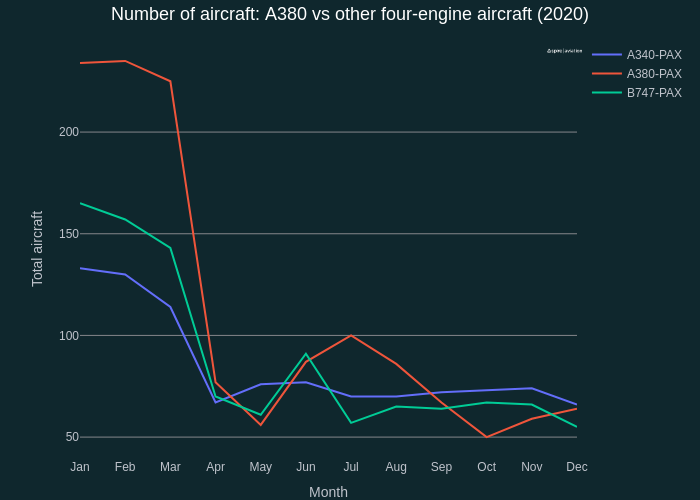
Quentin-spire's interactive graph and data of "Number of aircraft: A380 vs other four-engine aircraft (2020)" is a line chart, showing %{meta.columnNames.y}, %{meta.columnNames.y}, %{meta.columnNames.y}; with Month in the x-axis and Total aircraft in the y-axis.. The x-axis shows values from 0 to 11. The y-axis shows values from 39.72222222222222 to 245.27777777777777.