Edit chart
Loading graph
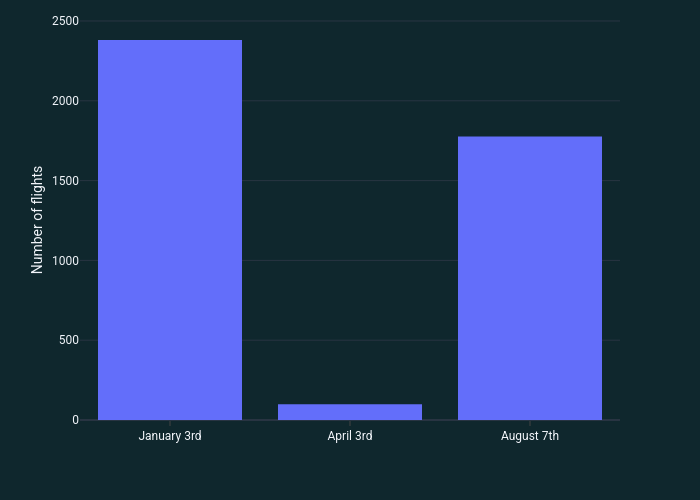
Quentin-spire's interactive graph and data of "" is a bar chart; with in the x-axis and Number of flights in the y-axis.. The x-axis shows values from -0.5 to 2.5. The y-axis shows values from 0 to 2506.315789473684.