Edit chart
Loading graph
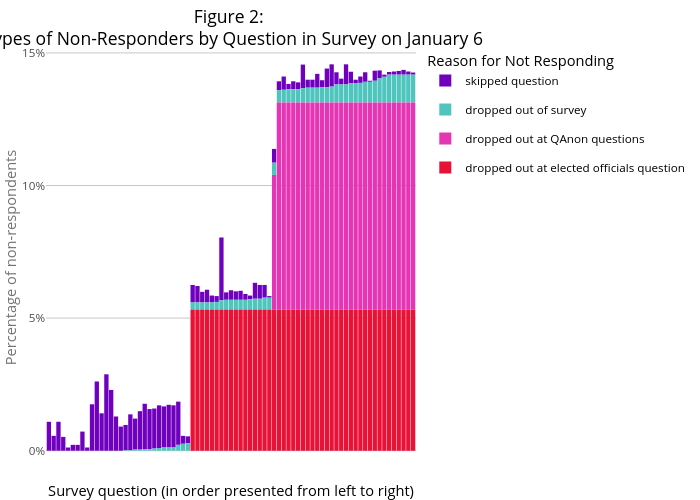
Publicwise's interactive graph and data of "Figure 2: Types of Non-Responders by Question in Survey on January 6" is a , showing skipped question, dropped out of survey, dropped out at QAnon questions, dropped out at elected officials question; with Survey question (in order presented from left to right) in the x-axis and Percentage of non-respondents in the y-axis.. The x-axis shows values from 0.4 to 77.6. The y-axis shows values from -0.007285 to 0.152985.