Edit chart
Loading graph
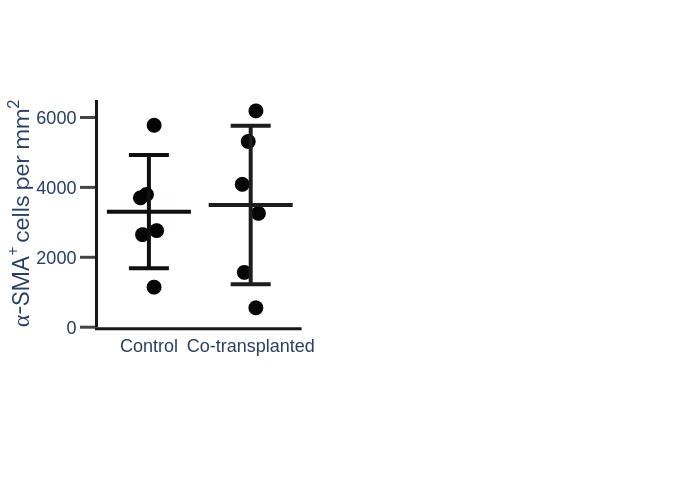
Psd724's interactive graph and data of "α-SMA+ cells per mm2 vs " is a box plot, showing , , ; with in the x-axis and α-SMA+ cells per mm2 in the y-axis.. The x-axis shows values from -0.5 to 1.5. The y-axis shows values from 0 to 6500.