Edit chart
Loading graph
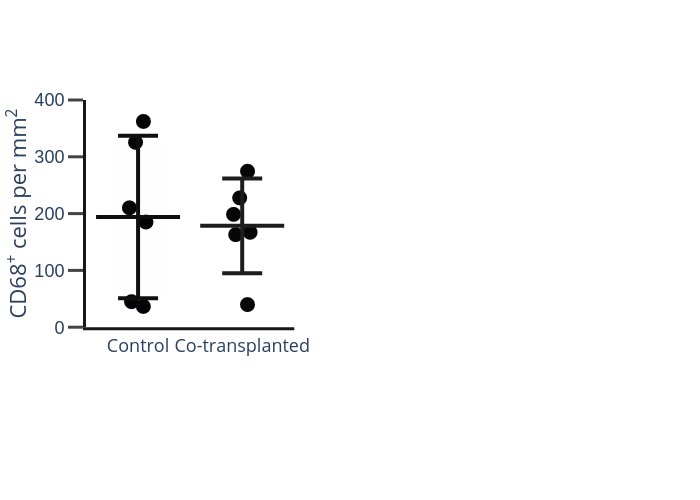
Psd724's interactive graph and data is a box plot; with CD68+ cells per mm2 in the y-axis. The x-axis shows values from -0.5 to 1.5. The y-axis shows values from 0 to 400.