Edit chart
Loading graph
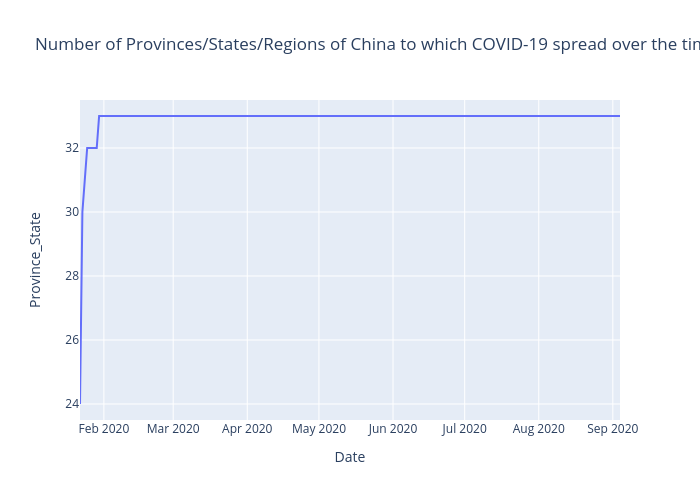
Priscilladanso's interactive graph and data of "Number of Provinces/States/Regions of China to which COVID-19 spread over the time" is a line chart; with Date in the x-axis and Province_State in the y-axis.. The x-axis shows values from 0 to 0. The y-axis shows values from 0 to 0.