Edit chart
Loading graph
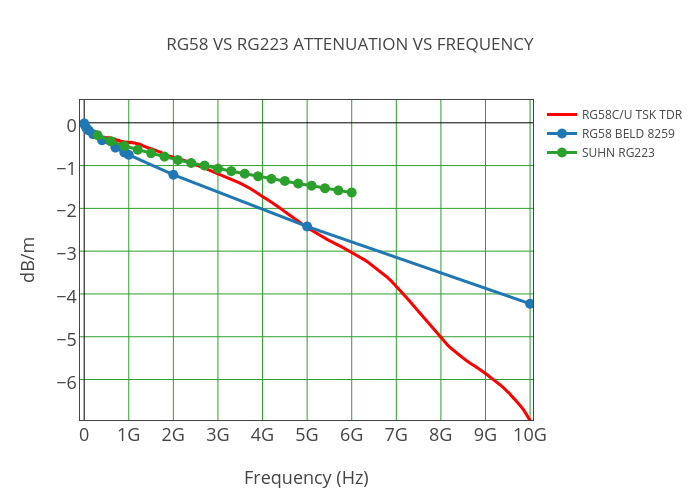
Piero.belforte's interactive graph and data of "RG58 VS RG223 ATTENUATION VS FREQUENCY" is a scatter chart, showing RG58C/U TSK TDR, RG58 BELD 8259, SUHN RG223; with Frequency (Hz) in the x-axis and dB/m in the y-axis.. The x-axis shows values from -93835454.39677262 to 10065548855.694267. The y-axis shows values from -6.9463100382522445 to 0.5327961604923033.