Edit chart
Loading graph
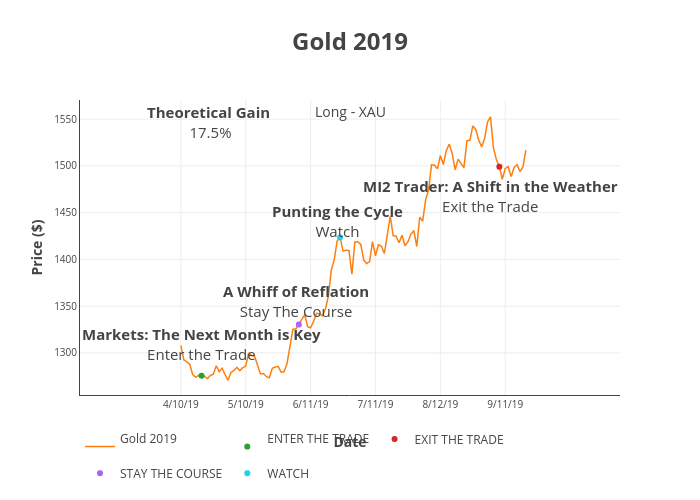
Peterlittman's interactive graph and data of "Gold 2019" is a line chart, showing Gold 2019, ENTER THE TRADE, EXIT THE TRADE, STAY THE COURSE, WATCH; with Date in the x-axis and Price ($) in the y-axis.. The x-axis shows values from -7.258198657971837 to 129.25819865797183. The y-axis shows values from 1255.0311111111112 to 1568.2088888888889. This visualization has the following annotations: Theoretical Gain 17.5%; Markets: The Next Month is KeyEnter the Trade; A Whiff of ReflationStay The Course; Punting the CycleWatch; MI2 Trader: A Shift in the WeatherExit the Trade; Long - XAU