Edit chart
Loading graph
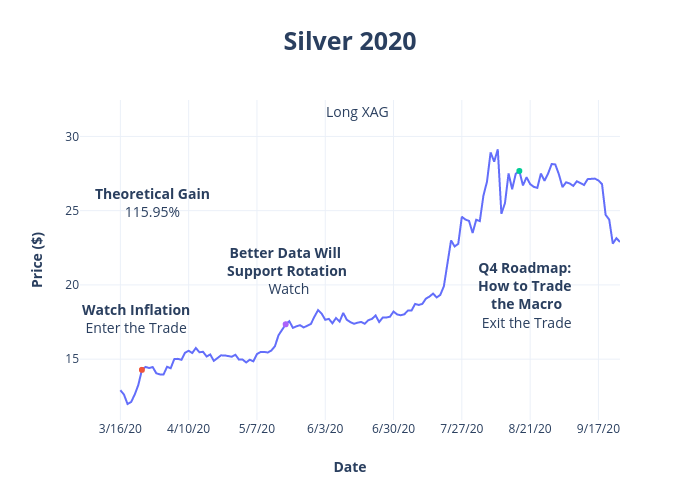
Peterlittman's interactive graph and data of "Silver 2020" is a line chart, showing , , , ; with Date in the x-axis and Price ($) in the y-axis.. The x-axis shows values from -8.130344418052257 to 139. The y-axis shows values from 10.903565870445345 to 32.45224846153846. This visualization has the following annotations: Better Data Will Support Rotation Watch; Watch InflationEnter the Trade; Q4 Roadmap:How to Trade the Macro Exit the Trade; Long XAG; Theoretical Gain115.95%