Edit chart
Loading graph
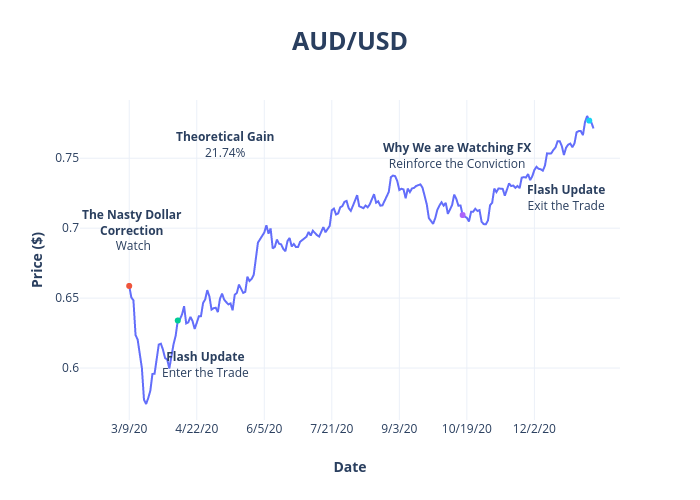
Peterlittman's interactive graph and data of "AUD/USD" is a line chart, showing , , , , ; with Date in the x-axis and Price ($) in the y-axis.. The x-axis shows values from -16.81067725407348 to 231.73447251159516. The y-axis shows values from 0.5628611111111111 to 0.7916388888888889. This visualization has the following annotations: Theoretical Gain21.74%; The Nasty DollarCorrection Watch; Flash UpdateEnter the Trade; Why We are Watching FXReinforce the Conviction; Flash UpdateExit the Trade