Edit chart
Loading graph
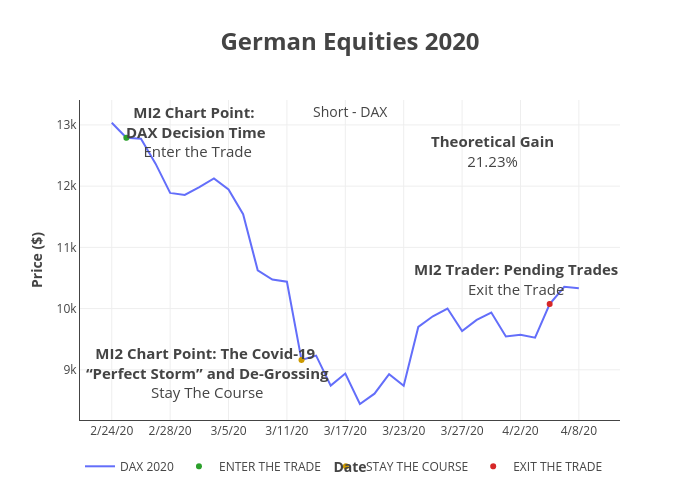
Peterlittman's interactive graph and data of "German Equities 2020" is a line chart, showing DAX 2020, ENTER THE TRADE, STAY THE COURSE, EXIT THE TRADE; with Date in the x-axis and Price ($) in the y-axis.. The x-axis shows values from -1.7936411678073294 to 32. The y-axis shows values from 8186.513888888888 to 13290.43611111111. This visualization has the following annotations: Theoretical Gain21.23%; Short - DAX; MI2 Chart Point: DAX Decision Time Enter the Trade; MI2 Chart Point: The Covid-19 “Perfect Storm” and De-Grossing Stay The Course; MI2 Trader: Pending TradesExit the Trade