Edit chart
Loading graph
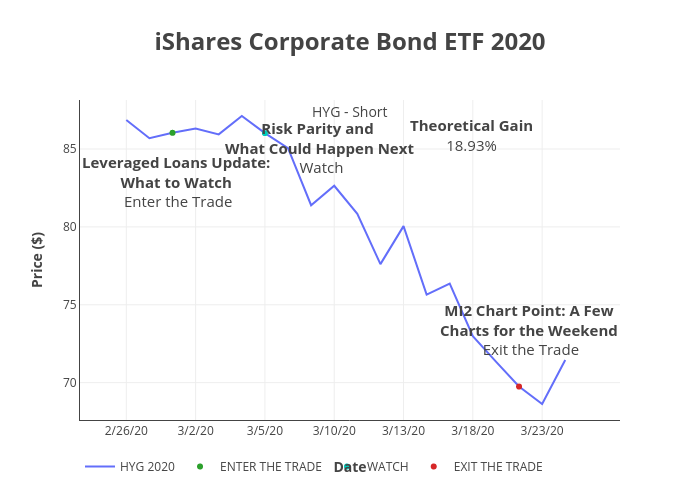
Peterlittman's interactive graph and data of "iShares Corporate Bond ETF 2020" is a line chart, showing HYG 2020, ENTER THE TRADE, WATCH, EXIT THE TRADE; with Date in the x-axis and Price ($) in the y-axis.. The x-axis shows values from -1.0661171596068235 to 19. The y-axis shows values from 67.60277777777777 to 88.14722222222223. This visualization has the following annotations: Theoretical Gain18.93%; Leveraged Loans Update:What to Watch Enter the Trade; Risk Parity and What Could Happen Next Watch; MI2 Chart Point: A FewCharts for the Weekend Exit the Trade; HYG - Short