Edit chart
Loading graph
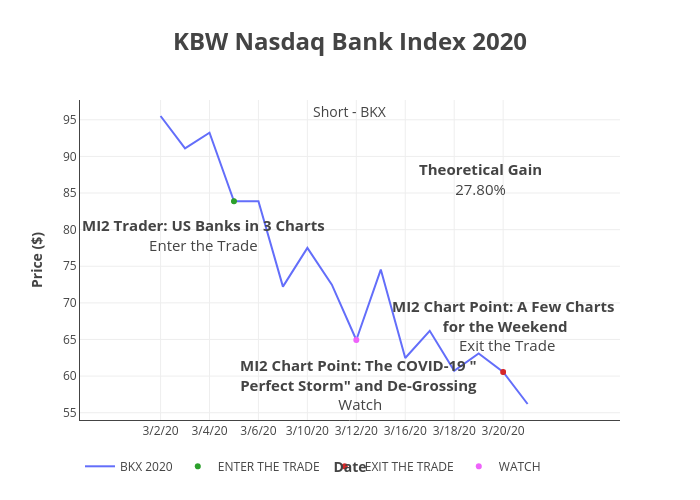
Peterlittman's interactive graph and data of "KBW Nasdaq Bank Index 2020" is a line chart, showing BKX 2020, ENTER THE TRADE, EXIT THE TRADE, WATCH; with Date in the x-axis and Price ($) in the y-axis.. The x-axis shows values from -0.924697279518997 to 16.190475031260057. The y-axis shows values from 54.004999999999995 to 97.705. This visualization has the following annotations: Theoretical Gain27.80%; MI2 Trader: US Banks in 3 ChartsEnter the Trade; MI2 Chart Point: The COVID-19 "Perfect Storm" and De-Grossing Watch; MI2 Chart Point: A Few Charts for the Weekend Exit the Trade; Short - BKX