Edit chart
Loading graph
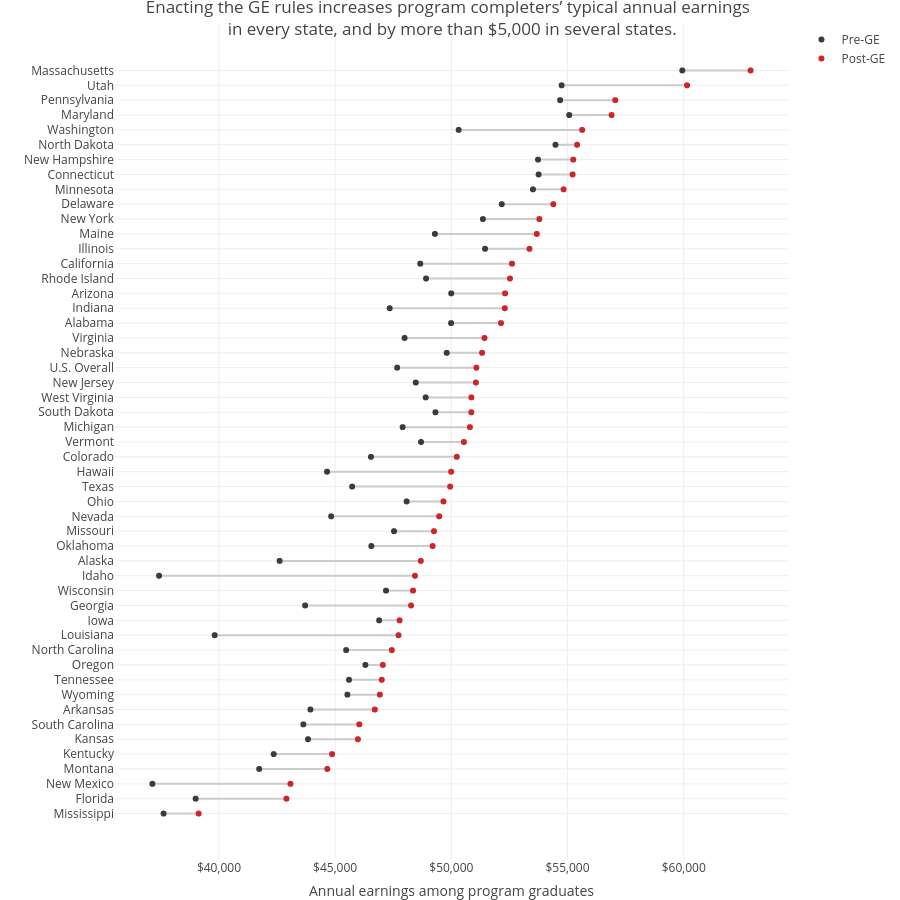
Petergranville's interactive graph and data of "Enacting the GE rules increases program completers’ typical annual earnings in every state, and by more than $5,000 in several states." is a line chart, showing Pre-GE vs Post-GE; with Annual earnings among program graduates in the x-axis. The x-axis shows values from 0 to 0. The y-axis shows values from 0 to 0.