Edit chart
Loading graph
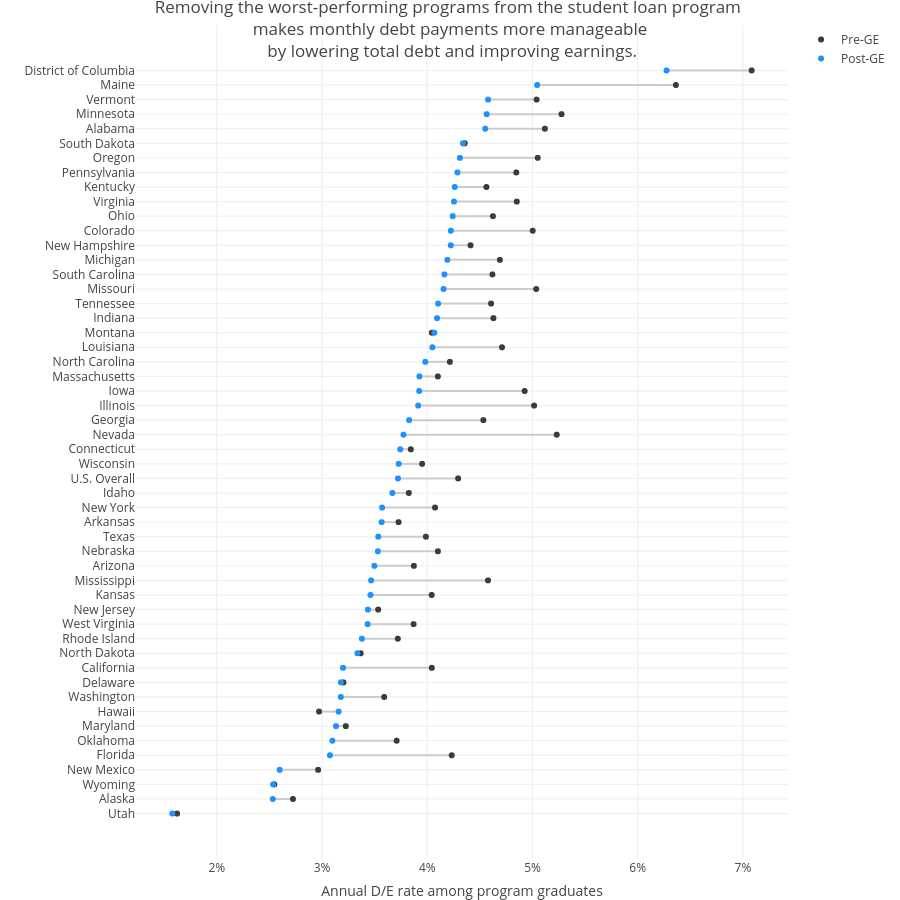
Petergranville's interactive graph and data of "Removing the worst-performing programs from the student loan program makes monthly debt payments more manageable by lowering total debt and improving earnings." is a line chart, showing Pre-GE vs Post-GE; with Annual D/E rate among program graduates in the x-axis. The x-axis shows values from 0 to 0. The y-axis shows values from 0 to 0.