Edit chart
Loading graph
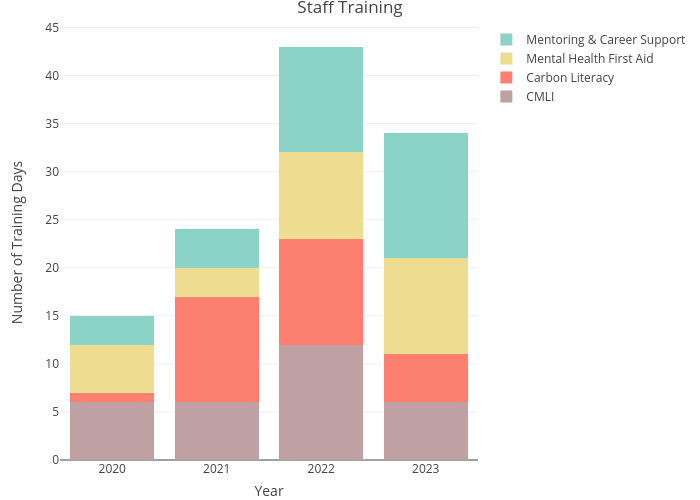
Paulam's interactive graph and data of "Staff Training" is a stacked bar chart, showing CMLI, Carbon Literacy, Mental Health First Aid, Mentoring & Career Support; with Year in the x-axis and Number of Training Days in the y-axis.. The x-axis shows values from 0 to 0. The y-axis shows values from 0 to 0.