Edit chart
Loading graph
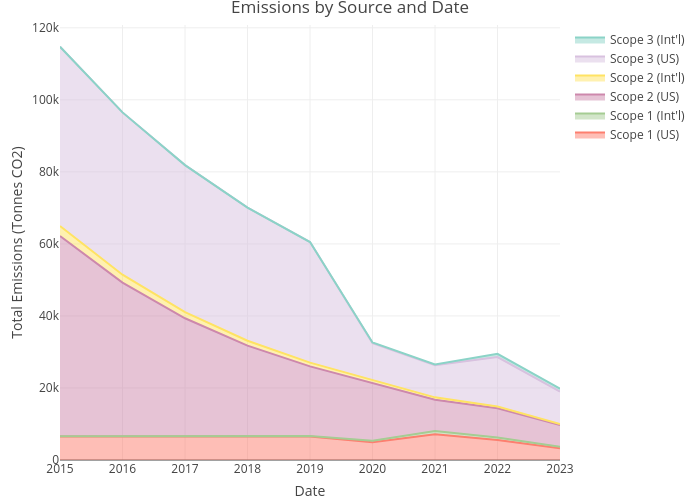
Paulam's interactive graph and data of "Emissions by Source and Date" is a line chart, showing Scope 1 (US), Scope 1 (Int'l), Scope 2 (US), Scope 2 (Int'l), Scope 3 (US), Scope 3 (Int'l); with Date in the x-axis and Total Emissions (Tonnes CO2) in the y-axis.. The x-axis shows values from 0 to 0. The y-axis shows values from 0 to 0.