Edit chart
Loading graph
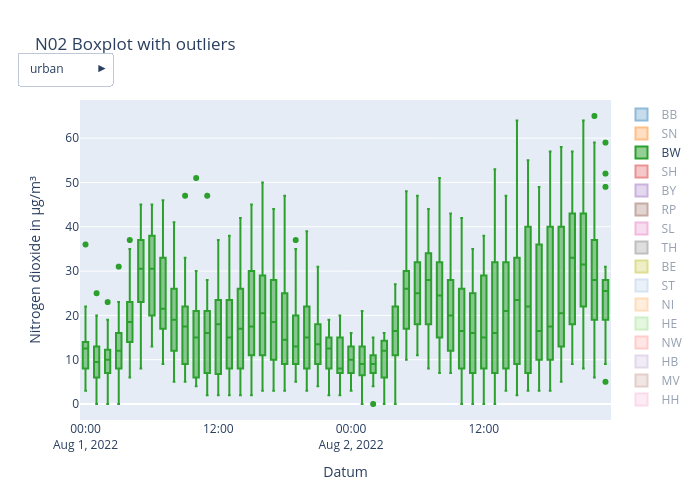
Pageca's interactive graph and data of "N02 Boxplot with outliers" is a box plot, showing BB, SN, BW, SH, BY, RP, SL, TH, BE, ST, NI, HE, NW, HB, MV, HH; with Datum in the x-axis and Nitrogen dioxide in µg/m³ in the y-axis.. The x-axis shows values from 0 to 0. The y-axis shows values from 0 to 0.