Edit chart
Loading graph
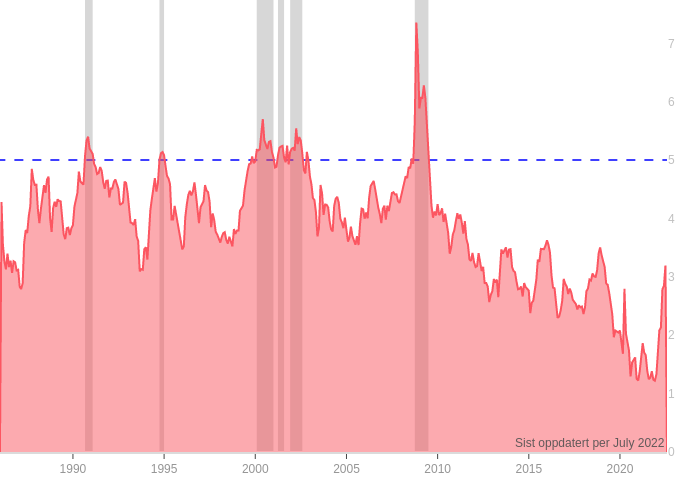
Oystein.nerva's interactive graph and data is a line chart. The x-axis shows values from 1986-01-01T00:00:00 to 2022-07-31T00:00:00. The y-axis shows values from 0 to 0. This visualization has the following annotation: Sist oppdatert per July 2022