Edit chart
Loading graph
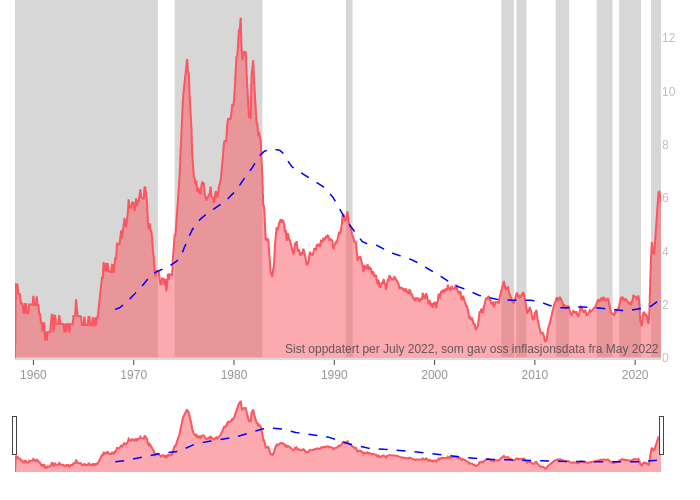
Oystein.nerva's interactive graph and data of " vs 10 år gjennomsnitt" is a line chart, showing vs 10 år gjennomsnitt. The x-axis shows values from 1958-03-01T00:00:00 to 2022-07-31T00:00:00. The y-axis shows values from 0 to 0. This visualization has the following annotation: Sist oppdatert per July 2022, som gav oss inflasjonsdata fra May 2022