Edit chart
Loading graph
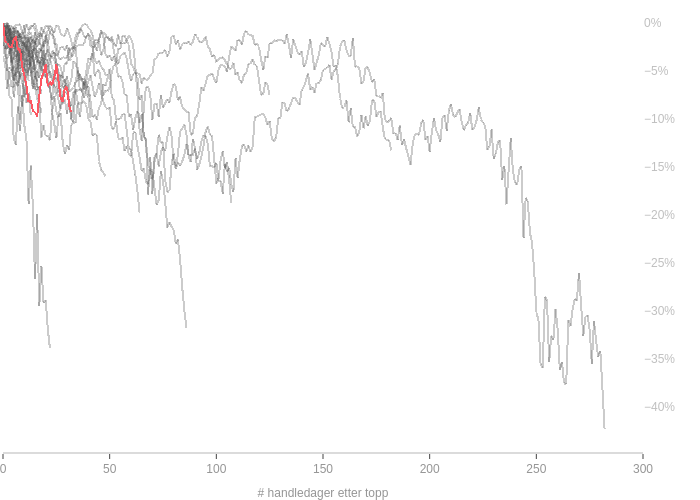
Oystein.nerva's interactive graph and data of "False vs True" is a scattergl, showing False vs True; with # handledager etter topp in the x-axis. The x-axis shows values from 0 to 300. The y-axis shows values from 0 to 0.