Edit chart
Loading graph
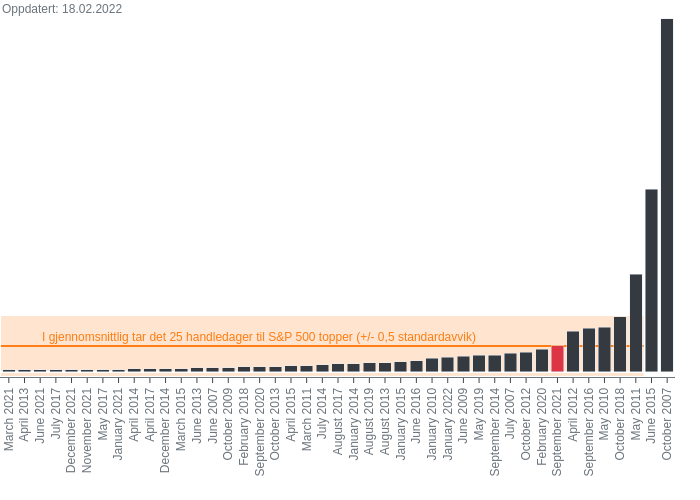
Oystein.nerva's interactive graph and data of "False vs True" is a stacked bar chart, showing False vs True. The x-axis shows values from 0 to 0. The y-axis shows values from 0 to 0. This visualization has the following annotations: Oppdatert: 18.02.2022; I gjennomsnittlig tar det 25 handledager til S&P 500 topper (+/- 0,5 standardavvik)