Edit chart
Loading graph
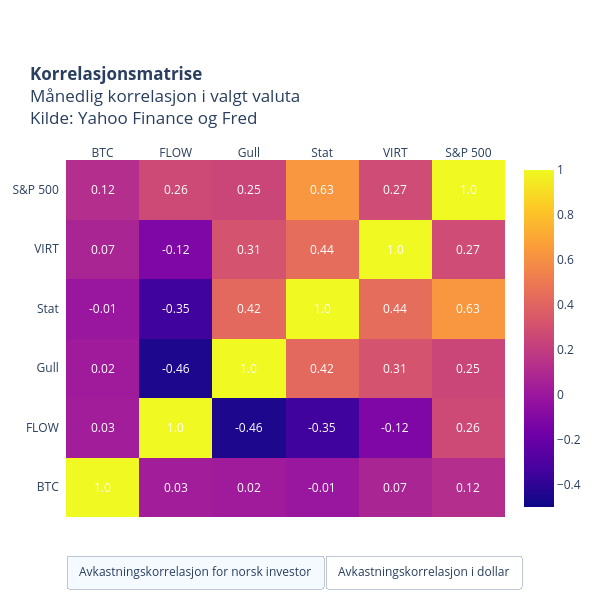
Oystein.nerva's interactive graph and data of "KorrelasjonsmatriseMånedlig korrelasjon i valgt valuta Kilde: Yahoo Finance og Fred" is a heatmap. The x-axis shows values from 0 to 0. The y-axis shows values from 0 to 0. This visualization has the following annotations: 1.0; 0.03; 0.02; -0.01; 0.07; 0.12; 0.03; 1.0; -0.46; -0.35; -0.12; 0.26; 0.02; -0.46; 1.0; 0.42; 0.31; 0.25; -0.01; -0.35; 0.42; 1.0; 0.44; 0.63; 0.07; -0.12; 0.31; 0.44; 1.0; 0.27; 0.12; 0.26; 0.25; 0.63; 0.27; 1.0