Edit chart
Loading graph
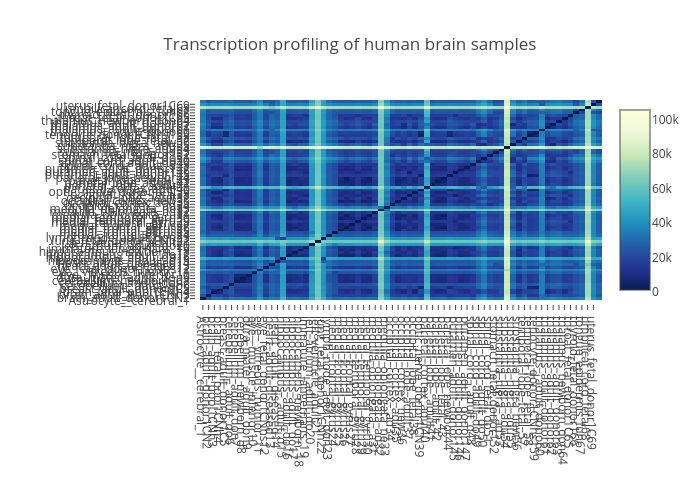
Oxana's interactive graph and data of "Transcription profiling of human brain samples" is a heatmap. The x-axis shows values from 0 to 0. The y-axis shows values from 0 to 0.