Edit chart
Loading graph
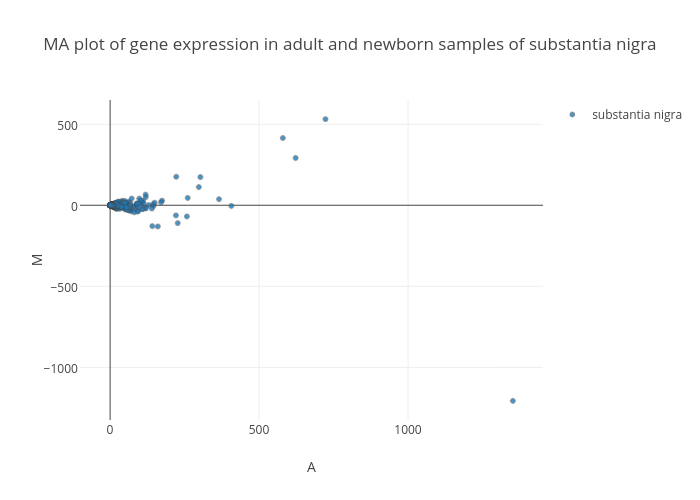
Oxana's interactive graph and data of "MA plot of gene expression in adult and newborn samples of substantia nigra" is a scatter chart, showing substantia nigra; with A in the x-axis and M in the y-axis.. The x-axis shows values from 0 to 0. The y-axis shows values from 0 to 0.