Edit chart
Loading graph
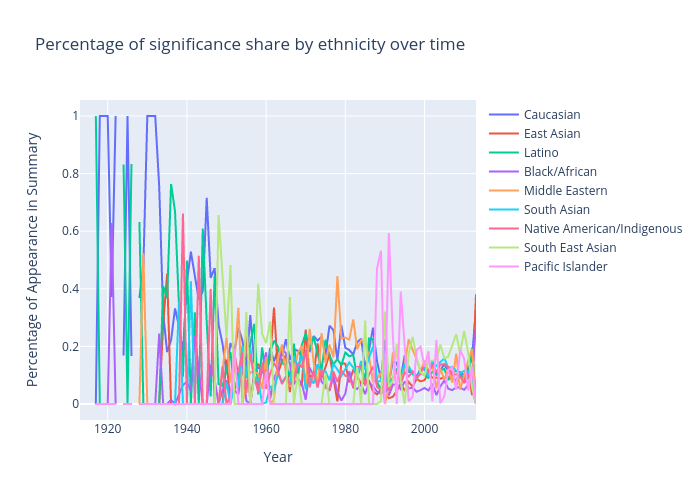
Oliviashi's interactive graph and data of "Percentage of significance share by ethnicity over time" is a line chart, showing Caucasian, East Asian, Latino, Black/African, Middle Eastern, South Asian, Native American/Indigenous, South East Asian, Pacific Islander; with Year in the x-axis and Percentage of Appearance in Summary in the y-axis.. The x-axis shows values from 0 to 0. The y-axis shows values from 0 to 0.