Edit chart
Loading graph
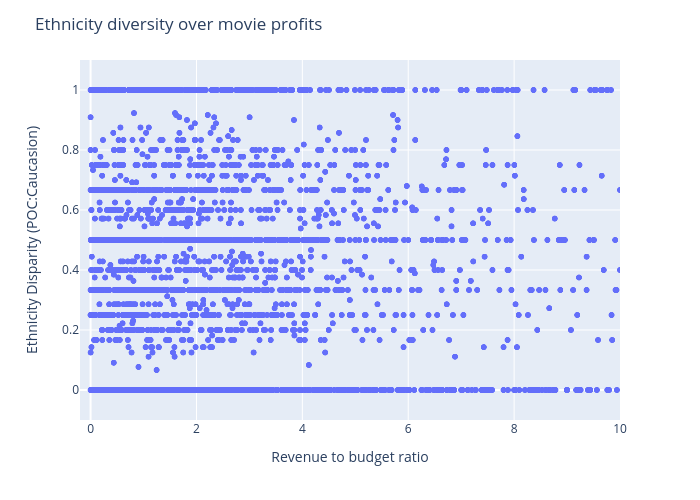
Oliviashi's interactive graph and data of "Ethnicity diversity over movie profits" is a scattergl; with Revenue to budget ratio in the x-axis and Ethnicity Disparity (POC:Caucasion) in the y-axis.. The x-axis shows values from -0.2 to 10. The y-axis shows values from -0.1 to 1.1.