Edit chart
Loading graph
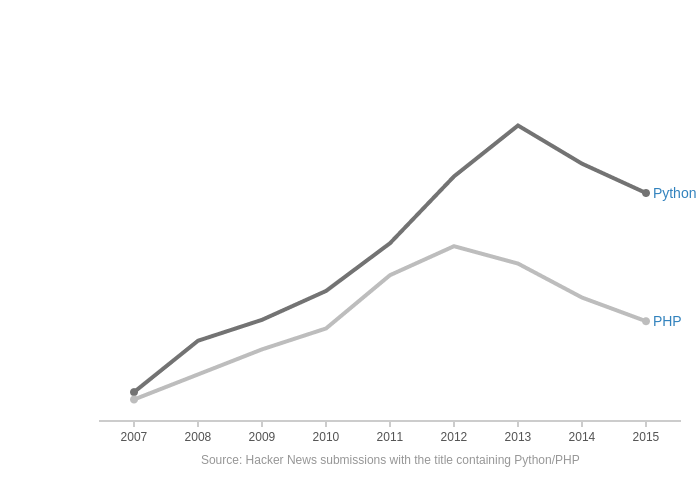
Octogrid's interactive graph and data is a line chart. The x-axis shows values from 0 to 0. The y-axis shows values from 0 to 0. This visualization has the following annotations: Python; PHP; Source: Hacker News submissions with the title containing Python/PHP