Edit chart
Loading graph
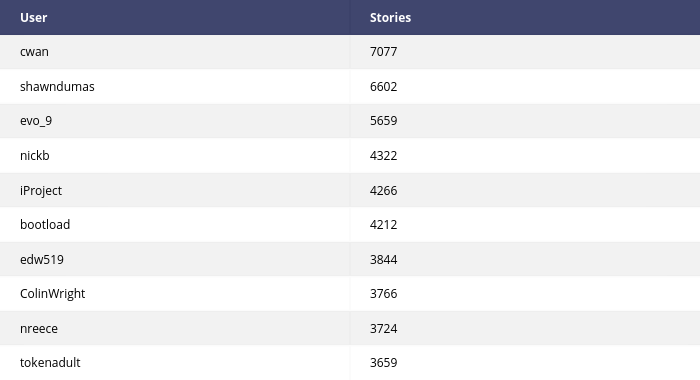
Octogrid's interactive graph and data is a heatmap. The x-axis shows values from 0 to 0. The y-axis shows values from 0 to 0. This visualization has the following annotations: User; Stories; cwan; 7077; shawndumas; 6602; evo_9; 5659; nickb; 4322; iProject; 4266; bootload; 4212; edw519; 3844; ColinWright; 3766; nreece; 3724; tokenadult; 3659