Edit chart
Loading graph
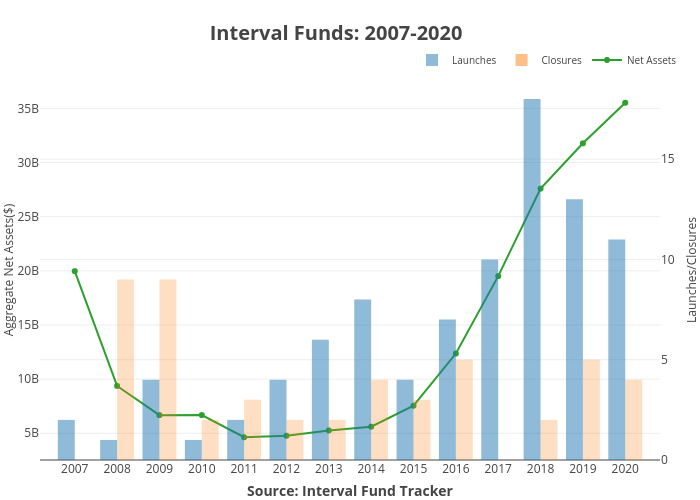
Ockhamdata's interactive graph and data of "Interval Funds: 2007-2020" is a bar chart, showing Launches, Closures, Net Assets; with Source: Interval Fund Tracker in the x-axis and Aggregate Net Assets($) in the y-axis.. The x-axis shows values from 2006.1454056695993 to 2020.8545943304007. The y-axis shows values from 2272391961.8746867 to 37881727662.12531.