Edit chart
Loading graph
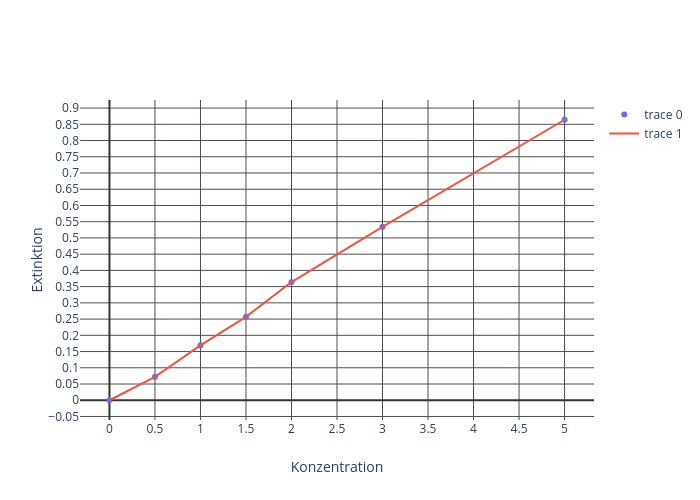
Obsididamn's interactive graph and data of "Extinktion vs Konzentration" is a scatter chart; with Konzentration in the x-axis and Extinktion in the y-axis.. The x-axis shows values from -0.304333970681963 to 5.304333970681963. The y-axis shows values from -0.05693521965748325 to 0.9209352196574833.