Edit chart
Loading graph
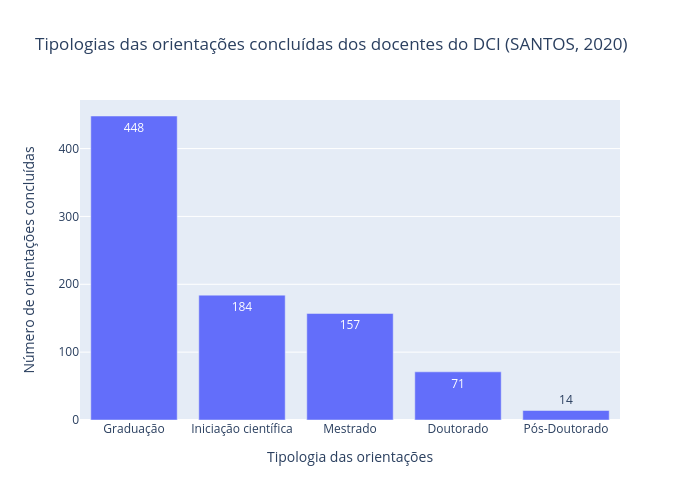
Nit.ufscar's interactive graph and data of "Tipologias das orientações concluídas dos docentes do DCI (SANTOS, 2020)" is a bar chart; with Tipologia das orientações in the x-axis and Número de orientações concluídas in the y-axis.. The x-axis shows values from -0.5 to 4.5. The y-axis shows values from 0 to 471.57894736842104.