Edit chart
Loading graph
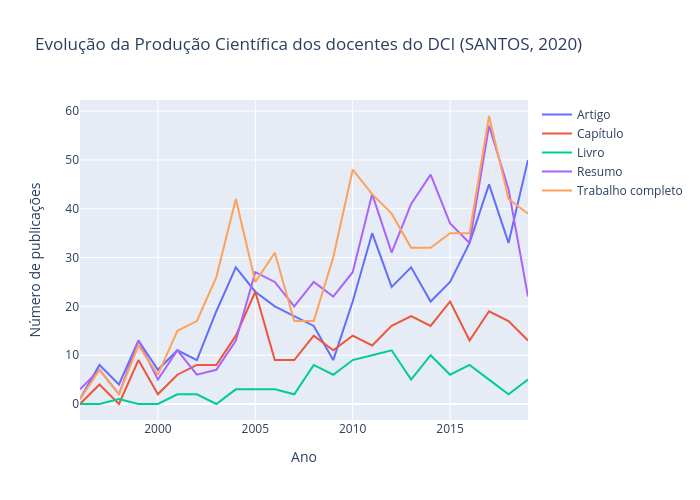
Nit.ufscar's interactive graph and data of "Evolução da Produção Científica dos docentes do DCI (SANTOS, 2020)" is a line chart, showing Artigo, Capítulo, Livro, Resumo, Trabalho completo; with Ano in the x-axis and Número de publicações in the y-axis.. The x-axis shows values from 1996 to 2019. The y-axis shows values from -3.2777777777777777 to 62.27777777777778.