Edit chart
Loading graph
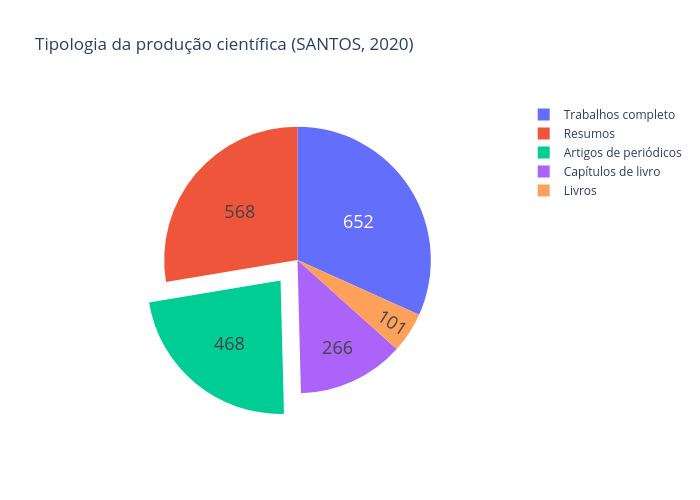
Nit.ufscar's interactive graph and data of "Tipologia da produção científica (SANTOS, 2020)" is a pie. The x-axis shows values from 0 to 0. The y-axis shows values from 0 to 0.