Edit chart
Loading graph
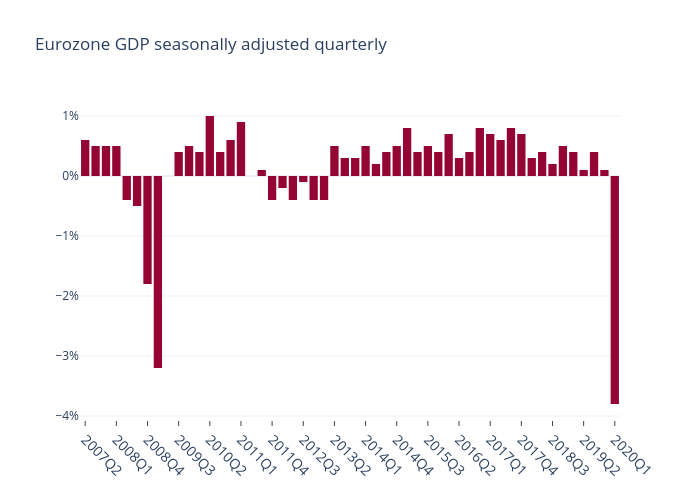
Niklasalbin's interactive graph and data of "Eurozone GDP seasonally adjusted quarterly" is a bar chart, showing Actual. The x-axis shows values from -0.5 to 51.5. The y-axis shows values from -4.066666666666666 to 1.2666666666666666.