Edit chart
Loading graph
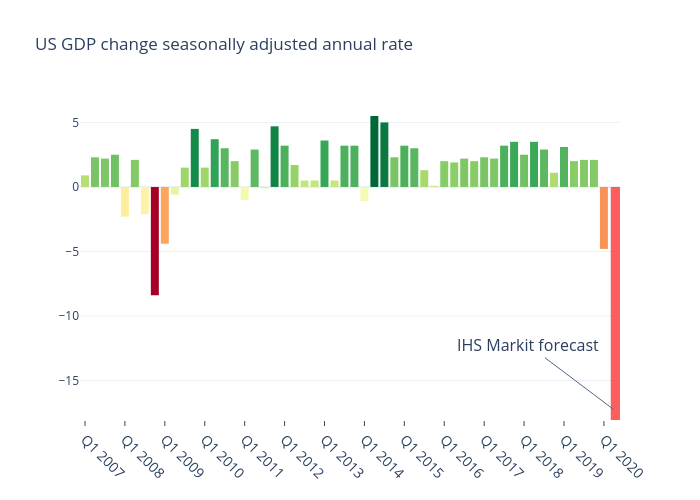
Niklasalbin's interactive graph and data of "US GDP change seasonally adjusted annual rate" is a bar chart, showing Actual. The x-axis shows values from -0.5 to 53.61251629726206. The y-axis shows values from -18.06112054329372 to 6.740058975962827. This visualization has the following annotation: IHS Markit forecast