Edit chart
Loading graph
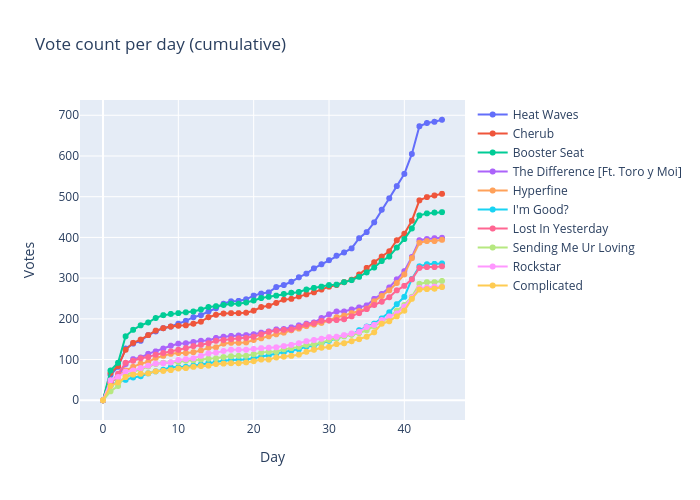
Nickw444's interactive graph and data of "Vote count per day (cumulative)" is a line chart, showing Heat Waves, Cherub, Booster Seat, The Difference [Ft. Toro y Moi], Hyperfine, I'm Good?, Lost In Yesterday, Sending Me Ur Loving, Rockstar, Complicated; with Day in the x-axis and Votes in the y-axis.. The x-axis shows values from -2.772806634657355 to 47.77280663465736. The y-axis shows values from -40.97036203338962 to 729.9703620333896.