Edit chart
Loading graph
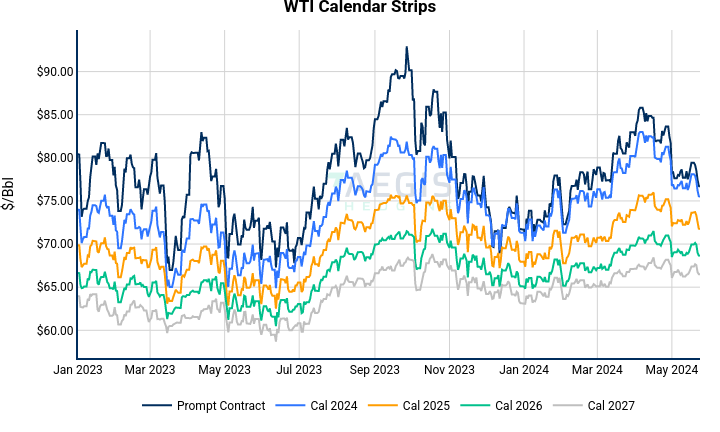
Nhillman_aegis2's interactive graph and data of "WTI Calendar Strips" is a line chart, showing Prompt Contract, Cal 2024, Cal 2025, Cal 2026, Cal 2027; with $/Bbl in the y-axis. The x-axis shows values from 0 to 0. The y-axis shows values from 0 to 0.