Edit chart
Loading graph
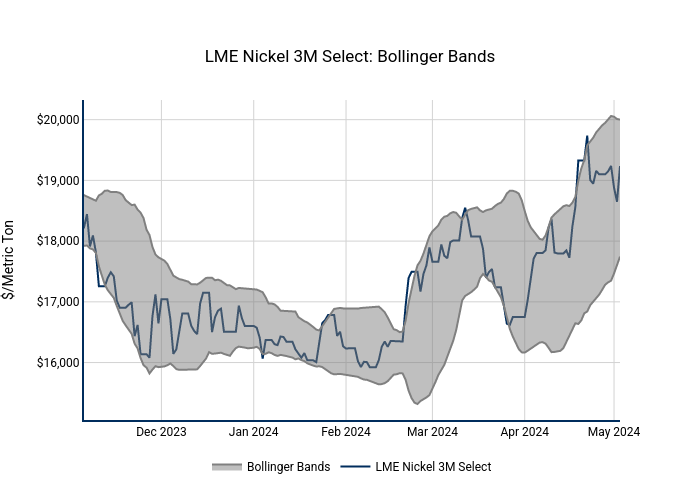
Nhillman_aegis2's interactive graph and data of "LME Nickel 3M Select: Bollinger Bands" is a line chart, showing LME Nickel 3M Select, 3mo ub, Bollinger Bands; with $/Metric Ton in the y-axis. The x-axis shows values from 2023-10-29 to 2024-04-26. The y-axis shows values from 0 to 0.