Edit chart
Loading graph
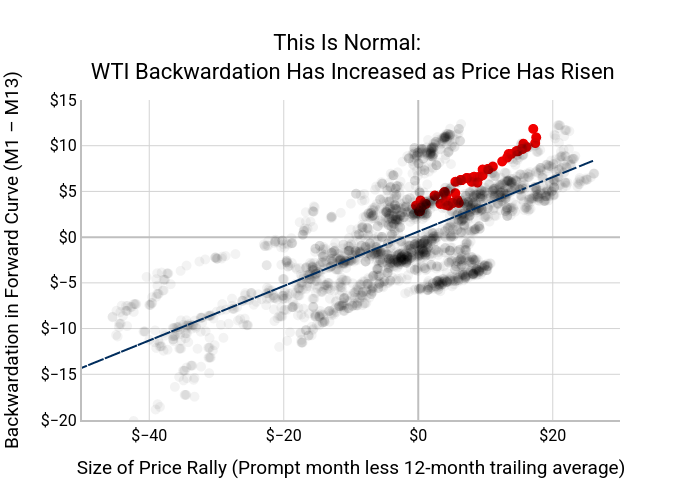
Nhillman_aegis2's interactive graph and data of "This Is Normal: WTI Backwardation Has Increased as Price Has Risen" is a scatter chart, showing , , Trendline; with Size of Price Rally (Prompt month less 12-month trailing average) in the x-axis and Backwardation in Forward Curve (M1 – M13) in the y-axis.. The x-axis shows values from -50 to 30. The y-axis shows values from -20 to 15.