Edit chart
Loading graph
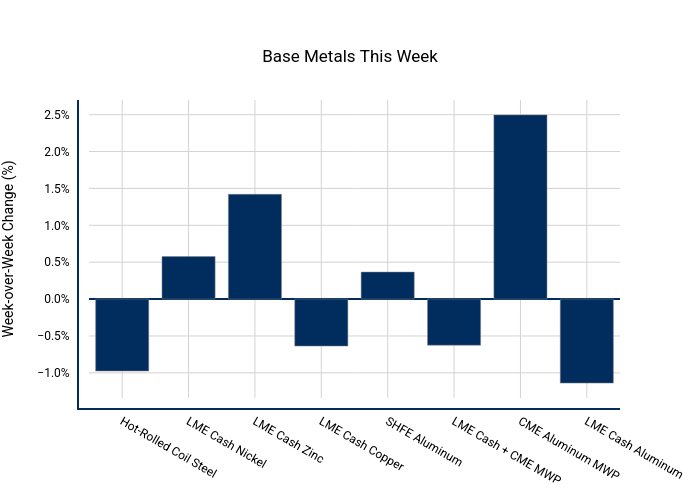
Nhillman_aegis2's interactive graph and data of "Base Metals This Week" is a bar chart; with Week-over-Week Change (%) in the y-axis. The x-axis shows values from 0 to 0. The y-axis shows values from 0 to 0.