Edit chart
Loading graph
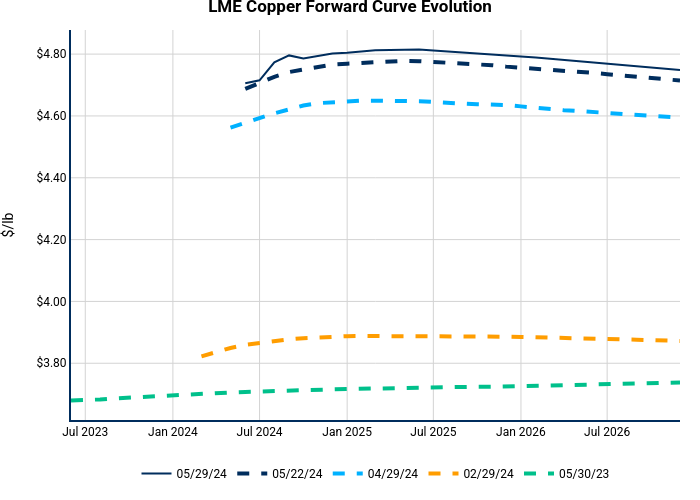
Nhillman_aegis's interactive graph and data of "LME Copper Forward Curve Evolution" is a line chart, showing 04/26/24, 04/19/24, 03/27/24, 01/27/24, 04/27/23; with $/lb in the y-axis. The x-axis shows values from 0 to 0. The y-axis shows values from 0 to 0.