Edit chart
Loading graph
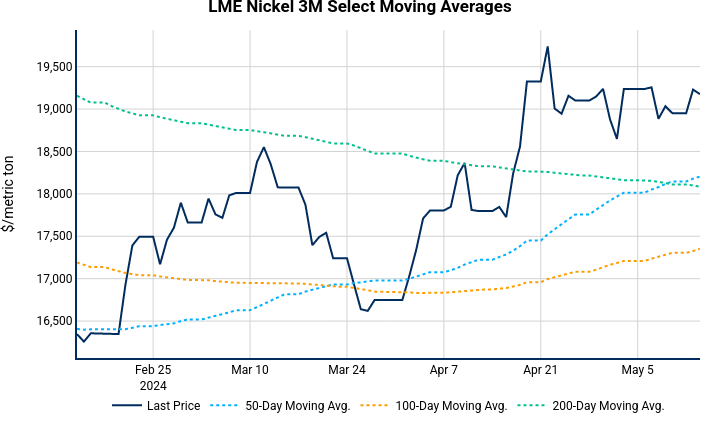
Nhillman_aegis's interactive graph and data of "LME Nickel 3M Select Moving Averages" is a line chart, showing Last Price, 50-Day Moving Avg., 100-Day Moving Avg., 200-Day Moving Avg.; with $/metric ton in the y-axis. The x-axis shows values from 2024-01-27 to 2024-04-26. The y-axis shows values from 0 to 0.