Edit chart
Loading graph
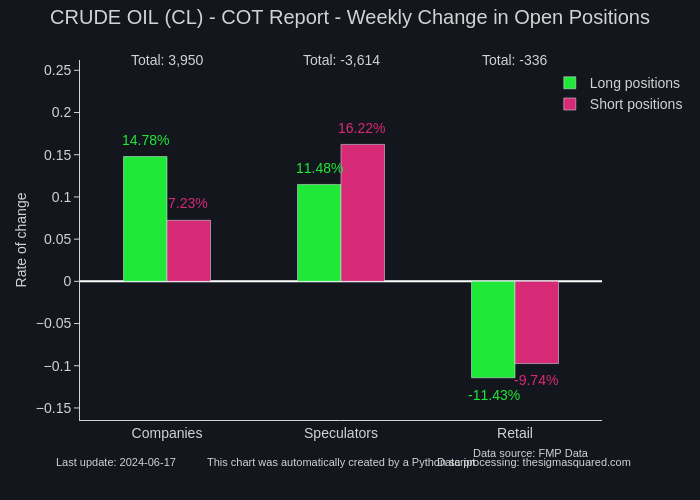
Neuro17's interactive graph and data of "CRUDE OIL (CL) - COT Report - Weekly Change in Open Positions" is a grouped bar chart, showing Long positions vs Short positions; with Rate of change in the y-axis. The x-axis shows values from 0 to 0. The y-axis shows values from -0.2650305645451277 to 0.21344639319708172. This visualization has the following annotations: Data source: FMP Data; Data processing: thesigmasquared.com; This chart was automatically created by a Python script; Last update: 2024-05-13; -19.87%; 11.34%; 3.75%; -14.68%; -7.28%; -21.50%; Total: -8,442; Total: 6,305; Total: 2,137